
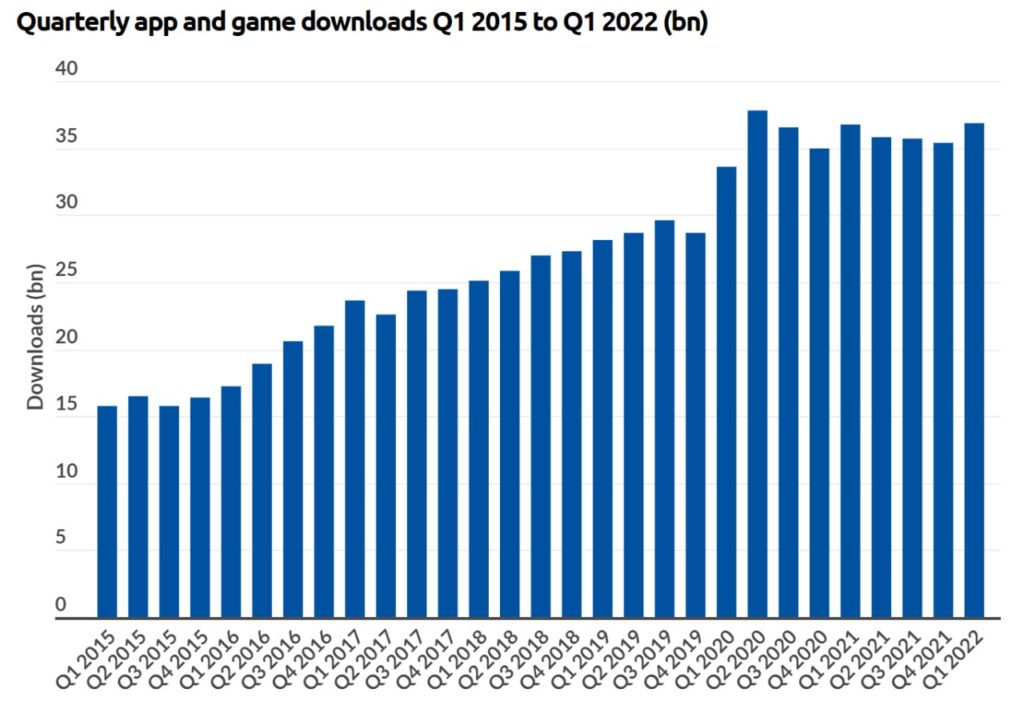
143.9 billion applications were downloaded in 2021. Off these 55 billion were games and 88 billion were apps.
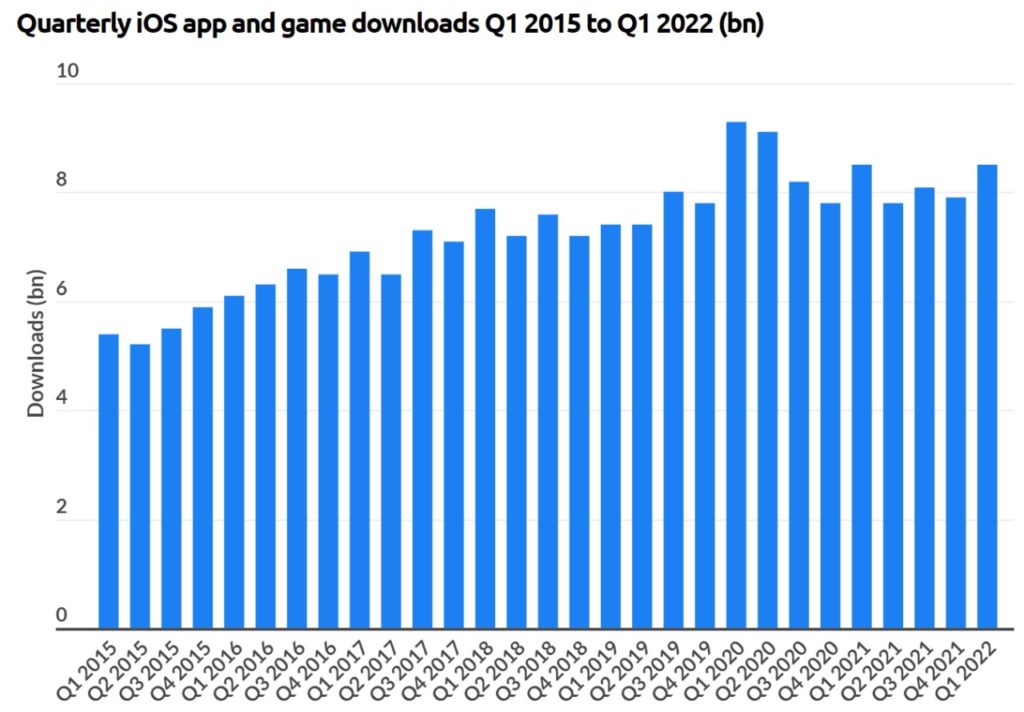
Google Play Store took credit for 111.4 billion downloads while iOS accounted for 32.5 billion.
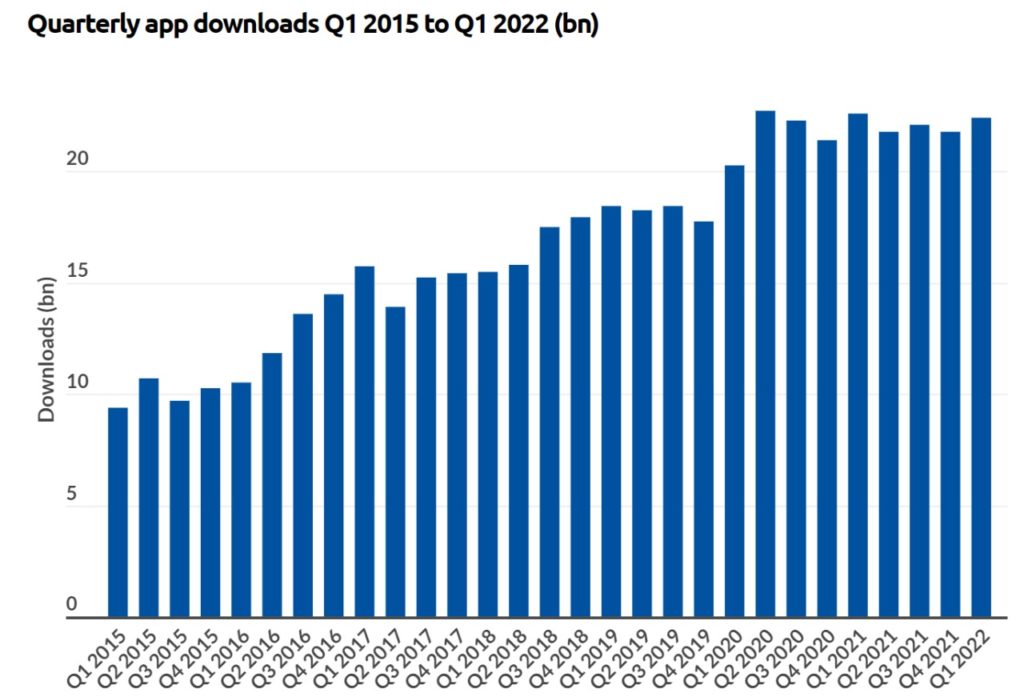
Mobile application trends suggests app downloads went up consistently YoY during the last decade and saw a dramatic leap in 2020 after the onset of the COVID-19 pandemic. 2020 year displayed the highest increase in app downloads since 2013 when the downloads went up by 24%.
History Of App Downloads
iOS App Store was launched in the year 2008 with 500 apps. Today, there are over seven million apps (games & apps put together) available across iOS and Android platforms.
Only iOS application downloads of apps and games declined for the first time in 2021 from over a decade. It fell from 34.4 billion downloads in 2020 to 32.3 billion in 2021.
Apps play a decisive role to make our lives convenient, simple and easy. We use them to order grocery, access telemedicine, buy insurance, listen to music, meet romantic partners, buy & sell used goods, book tickets, order food or a ride, do banking and make payments.
Mobile Application Trends
The market for these apps continue to grow as every domain now demands an app for consumers to conveniently conduct business from any location. There are an estimated six billion smartphone users worldwide, with five billion of them having access to the internet.
Some popular apps such as Meta, WhatsApp, Alibaba and YouTube, have more users than the population of China.
Smartphones are reaching ubiquitous levels of usage with the median penetration level for adults staring at 76%. In South Korea, 95% of adults own a smartphone.
Emerging economies like Brazil and South Africa have penetration levels of 60%. India lags with 24%, but that still represents millions of users.
2021: A Transformative Year
The global shift toward mobiles continue as more users turn to apps for entertainment, information, social assimilation and performing daily tasks.
The industry successfully coped with broad shifts in consumer patterns and user habits enforced due to the COVID-19 pandemic, including sustained lockdowns and social distancing.
Despite such challenges, the mobile app ecosystem continues to thrive, demonstrating the robustness and adaptability of the app marketing industry.
In 2021, consumer spend on mobile apps touched $170 billion, marking a 19% increase from 2020. Ad spend reached a record $288 billion in 2021 and is predicted to grow to $336 billion this year.
Domains With Highest Disruption
This year the competition is fierce in most domains, but opportunities are immense. We have taken up a study of mobile application trends in the Fintech and the Ecommerce industry as these domains have seen the highest application of technology and have gained from it considerably too.
In here we have provided marketers with the insights needed to drive performance and comprehensive understanding of audiences via pragmatic data.
Fintech
- Banking app revenue increased by 88% as compared to 2020 and reached $6.82 billion in 2021.
- Finance app downloads accounted for 573 million in the US, a 19% rise as compared to 2020.
- Around 52% of purchases were made using a digital wallet in 2021. Since 2019 use of cash declined by 42%.
- Top markets for fintech apps was in North America in 2021. This was basically to pay bills, perform banking, file taxes, send money, investing, and buying / selling of crypto currencies.
- China is the global leader for mobile payments, with 87% adoption rate, South Korea at 46%, the US is at 43%, and India at 40%.
E-commerce
- Smartphones hold the reins to e-commerce, with 67% of e-commerce sales coming from mobiles in 2021, which is up 14% from 2020.
- In 2021, 55% of people shopped using smartphones after viewing a social media ad.
- In 2021, the time spent on shopping apps went over 100 billion hours, an 18% rise YoY.
- Top e-commerce apps saw 35% rise in MAUs.
- Mobile retail e-commerce sales rose by 22% to touch $3.56 trillion worldwide in 2021.
Healthy Mobile Ecosystem: 2 Million New Apps & Games Released In 2021
Total numbers of apps and games ever released on iOS and Google Play is over 21 million. In 2021 Google Play accounted for 77% of all apps and games released. Of all new releases in 2021, games represented 15% across both iOS and Google Play.
The remaining 85% new apps consists of categories such as social media, ecommerce, service apps, insurance, edtech, dating, deliveries, banking, and healthcare.
Smartphones provide unparalleled reach and access to billions of consumers worldwide. This converts every business a mobile-focused industry.
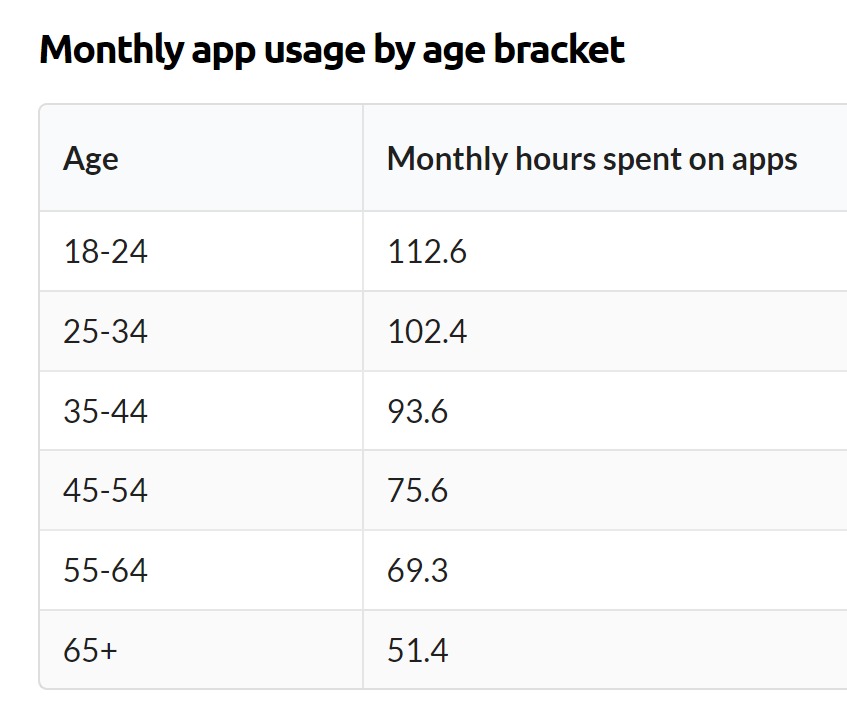
Users Spend 33% of Waking Hours On Mobile
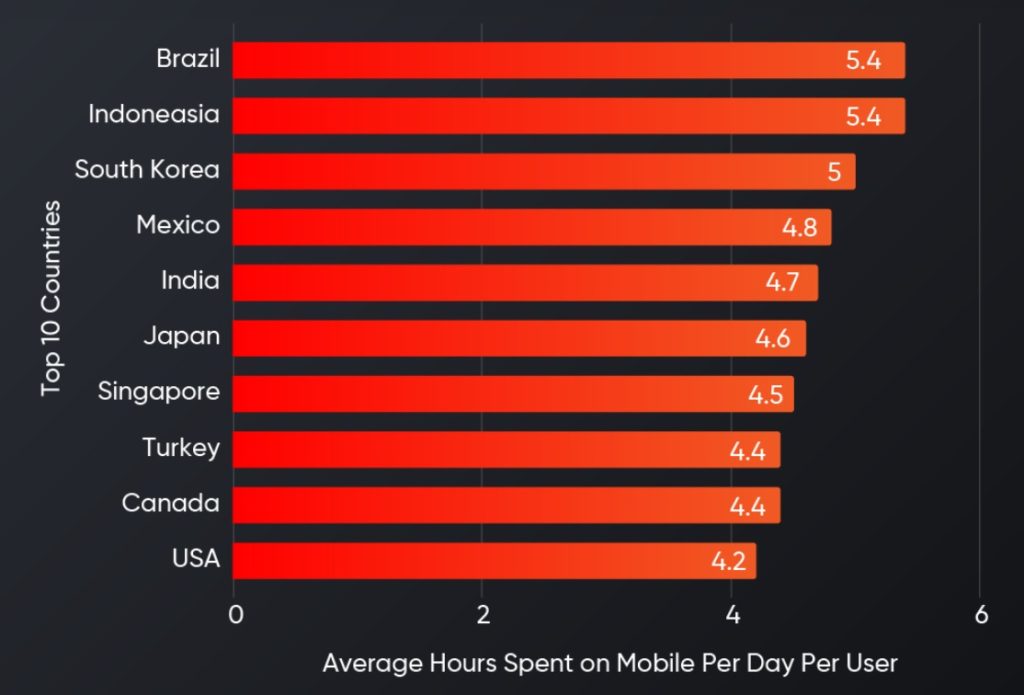
Across top 10 markets that were analyzed regarding mobile application trends, the weighted average for usage on a daily basis exceeded 4 hours 47 minutes in 2021 — up 30% from 2019.
Users in Brazil, Indonesia and South Korea topped 5 hours per day spent on mobile apps in 2021.
In 2021 the average American viewed 3.1 hours of TV in a day and spent 4.1 hours on their smartphones.
Gen Z Is Social Media & Video First Generation
Apps in categories that are highly relevant to Gen Z are mediums that garner engagement, that include Photo & short Video apps, entertainment, and Social proximity.
Finance and Shopping apps haven’t made much in-roads to reach higher numbers of Gen Z audience. Yet these categories have experienced strong growth YoY, encouraging entrepreneurs and investors to take a notice. These categories tend to tip more towards Millennials right now.
Differences Based On Gender In App Usage
Sports apps finds maximum traction with males in each analyzed market, whereas Food & Drink apps tend to find favor with females. However, the difference can be minimal in the US for Food & Drink segment. But can be dramatic in markets like Japan.
We also see that the most used apps (considering gender) in each country tend to differ with the category of apps. Shopping apps on the whole tend to tip towards more female overall. Yet Amazon tips more towards male in France, Germany, Japan, the UK, and Canada. Only in the US does Amazon find favor with females.
We have analyzed the categories limited to males and females only.
Mobile Ads Top $295 Billion in 2021, Up 23% YoY Is Poised to Hit $350 Billion in 2022
Mobiles are driving digital ad spend globally. In 2021 an economic rebound enhanced the global GDP by 5.9%.
Cyclic events like the Olympics, UEFA, F-1 races, tennis events, and ingrained mobile habits, helped capture 70% of digital ad revenue flow as mobile gained the primary and captive channel for engaging consumers.
With the Commonwealth Games, Asian Games, US mid-term elections slated to be held this year, digital ad spend is set to soar with the majority driven by mobiles. Brand marketing and performance marketing is set to pick up as businesses and brands exploit smartphone’s broad and captive audience amidst the backdrop of IDFA disapproval.
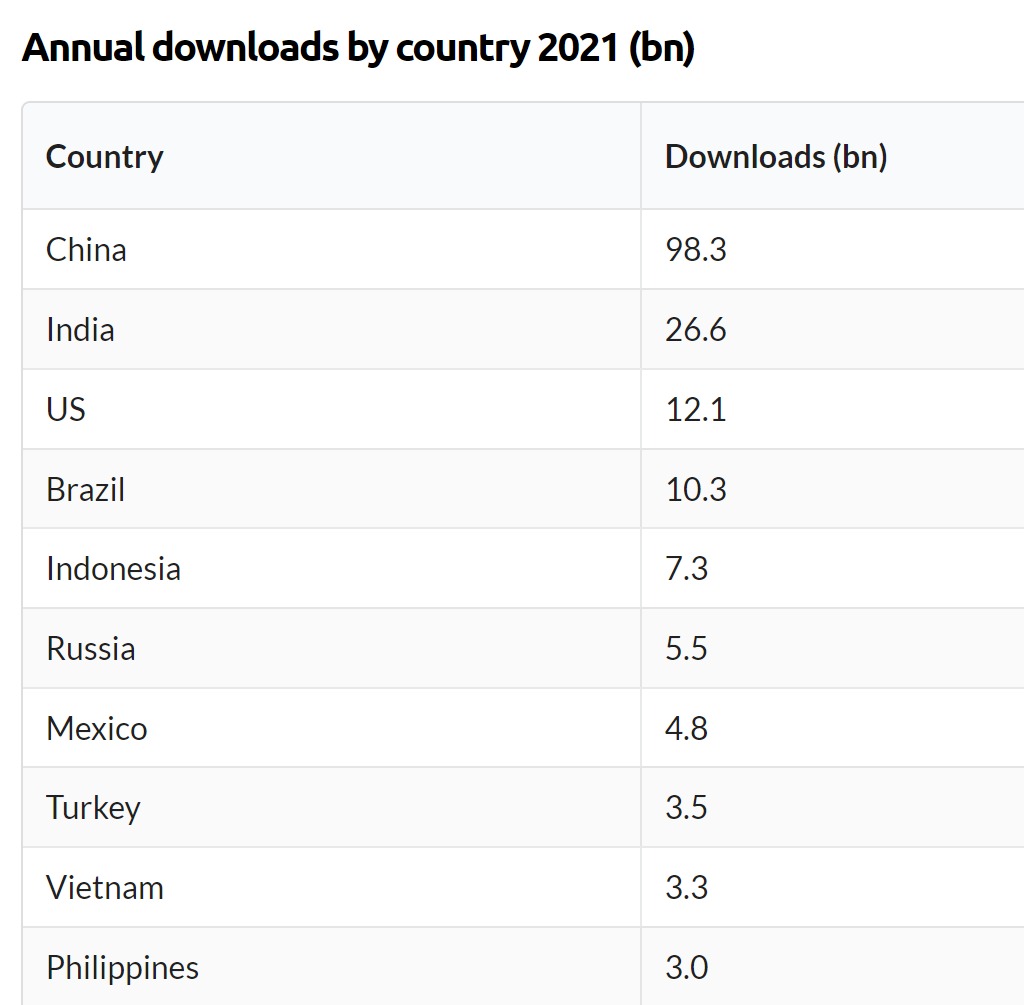
Emerging markets dominate for downloads growth
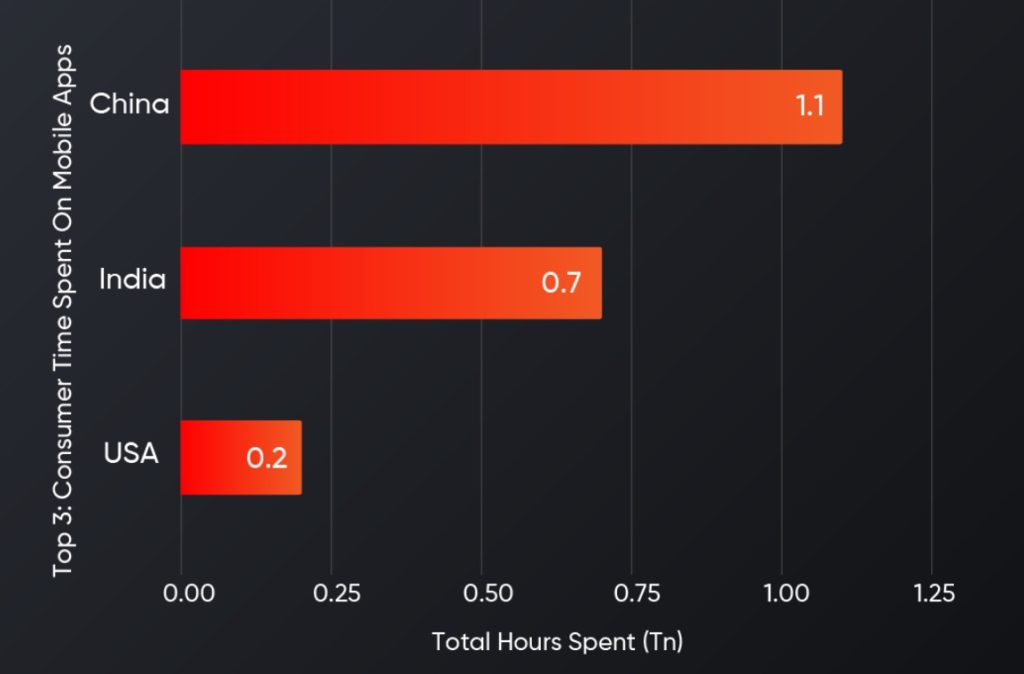
But China rules the roost when it comes to downloads with 98 billion, followed by India at 27 billion downloads and the US with 12 billion.
Pakistan, Peru, Philippines, Vietnam, Indonesia and Egypt were among the fastest growing markets for downloads at 25%, 25%, 25%, 20% 15% and 15% growth YoY, respectively.
70% Of Time Spent On Social, Photo & Video Apps in 2021
As time spent on mobiles increase, emerging categories holding the attention of consumers are getting lucid. Apps that engage with users at a deeper level are Social, Communication, Picture and Short Form Video apps.
Photo & Video apps (YouTube, Instagram and TikTok) have seen exponential increase in market share on time spent. But this has not curtailed existing habits. Rather, consumers have gone on to turn ‘non-mobile’ time into time spent in apps and games.
233 Apps & Games Generated Over $100 Million In 2021
Consumers are beginning to adopt and migrate to mobiles for games and entertainment. In 2021, a combination of 230 apps and games earned $100 million in annual consumer spend, with 12 of them surpassing $1 Billion.
This is up 20% from 2020 at 193 apps and games with over $100 Million in annual spend, and only 8 over $1 Billion.
Improved net connectivity, increased screen size and better hardware have made it easier than ever to enjoy innovative applications and exhilarating gaming experiences. Consumers have now begun to share wallet in mobiles as the existing gaming console and a tool to manage lives.

After an Engineering degree and a Diploma in Management I devoted 16+ years working in the automotive industry. My innate skill and extreme passion in writing, encouraged me to adopt it up as a profession. I have been writing for more than 10+ years in the software industry. The 400+ blogs I published are informative, exhaustive and interesting to a professional and causal reader.